


What’s the buzz about HYROX?
By Vlad Matei
If you’ve landed on this article, you’ve probably heard of HYROX before, with its recent growth in popularity. You may have seen it somewhere on social media, heard about it at your local gym, or might have even competed in one.
However, for those unfamiliar with the event, HYROX is a fitness race, branding itself as the “global fitness race for everybody”.
Founded in 2017, the race combines running with functional exercises. Participants run a total of 8 kilometers, split in 1 kilometer intervals with 1 functional exercise in-between each run. Hyrox is open for anyone to sign up, and most people with a decent level of fitness will be able to complete each movement. Goes without saying that, the fitter and more competitive the athlete, the faster the time. Similar to a marathon or other running races, Hyrox allows everyday competitors that are there just for the fun of the event and for the personal challenge to race against some of the fittest athletes in the world.
How did this analysis come about?
Having signed up for Hyrox Rotterdam 2024, I became curious as to the sorts of times I should be aiming for on each of the runs and stations. I knew what my 5k time would be, I had an idea of what a fast 1km run would look like for me, but I had no idea what times to expect on the stations, or even what my running times would look like on tired legs following the functional stations.
As someone who works with data in their day job, I started Googling to see if there’s any data available and came across this Kaggle notebook, for scraping data of the official Hyrox results web page.
Data Retrieval and Preparation
After stumbling across the notebook, I used the code, made slight adjustments to cover recent events, and pulled in data for 2023–2024 races as below:

As I was going to compete in a Men’s Open race — I decided to exclude the North American and World Championships results from my analysis.
After combining all races together into one large dataset, I decided to only include Men’s open results, leaving out other categories (any Pro results, or Open Doubles/Women’s/Relay).
As the scraper retrieves data directly from HYROX’s website, there wasn’t really a need for any data cleaning to be performed aside from one small bit of pre-processing, converting all times from their string format into total seconds taken. Following this, I was able to go straight into the analysis.
Questions to be answered
Are there any ‘difference-maker’ stations in the race?
Looking at the time people spend on each station, against average run times would help paint the picture of what to expect on each workout. This would give me an indication of where I might stand against my goal time, as well as see if any stations might be worth paying more attention to than others.

The plot shows how average times increase with each run, which is expected, given how fatiguing each of the stations is. Another interesting aspect is the sled push to sled pull ratio. Given the heavier weight on the push (152kg vs 102kg on the pull) I would have expected the stations to be closer in time, however, the data shows that the pull is an exercise on which people tend to spend more time. Perhaps unsurprisingly, it looks like people tend to start off quite fast, with the average time for the last run being almost 2 minutes longer than the first run. The roxzone (yellow line in the plot) is the ‘transition’ part of the race when athletes are switching between the runs and stations.
Looking at the average values gives a good idea of where you might be against your goal time, however, I wanted to gain a deeper understanding of how all athletes perform on each station and run. Looking at the distribution of times was the next logical step:
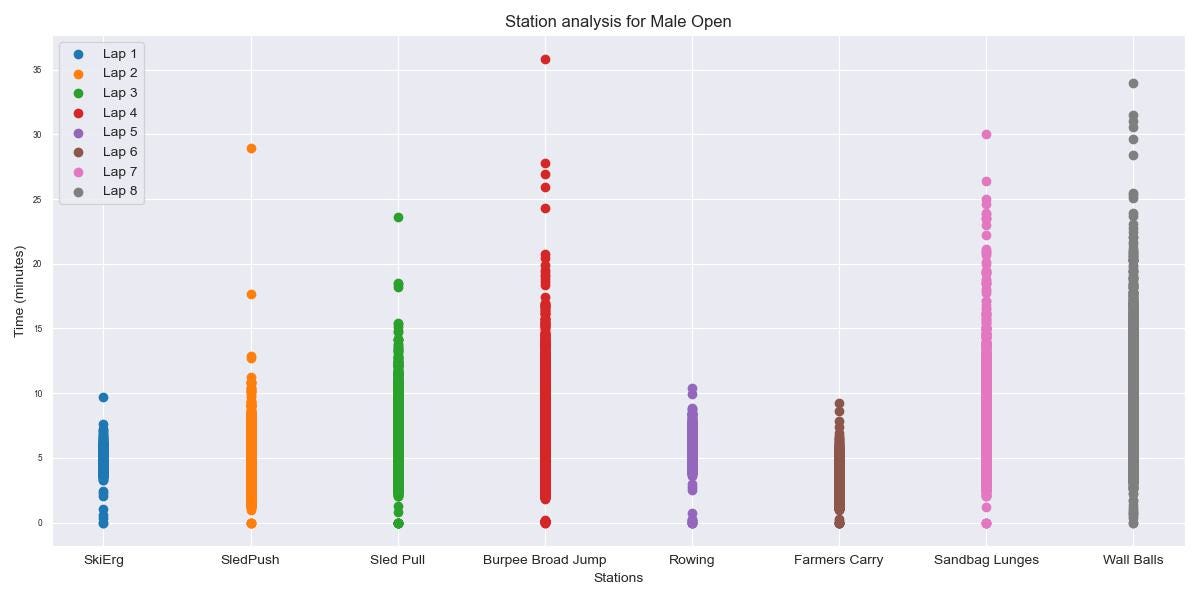
Here, we can see some interesting points come up.
- Lowest Variance: The ERGs, both SkiErg and RowErg show the least variance out of all exercises. This proves a common point most people with Hyrox experience will say: ‘you can’t win a race on the ERGs, but you can lose it there’. Meaning that pushing hard for a slightly better time on these stations might not be worth doing if it ends up affecting the rest of your stations, especially given how the SkiErg is the first station in the race.
- Greatest Variance: Wall Balls, Burpee Broad Jumps and Lunges show the greatest variance out of all stations. This shows that these are some of the stations that could be seen as the ‘difference’ makers, even for the ‘fast’ athletes. Saving minutes on these can be the difference between a 70-minute race, and being closer to the hour mark.
- Sled Pull vs Sled Push: On top of the larger average time, the sled pull also presents larger variability relative to the sled push. This makes sense, given how there is more technique involved in the pull exercise, compared to the sled pull. Some athletes choose to keep arms straight, using mostly legs, other combine both legs and arms, while others tend to pull the sled mostly using arm strength. The difference in styles can be seen as the reason for the larger variation. Another aspect could simply be the fatigue accumulated from the sled push once you reach the pull.
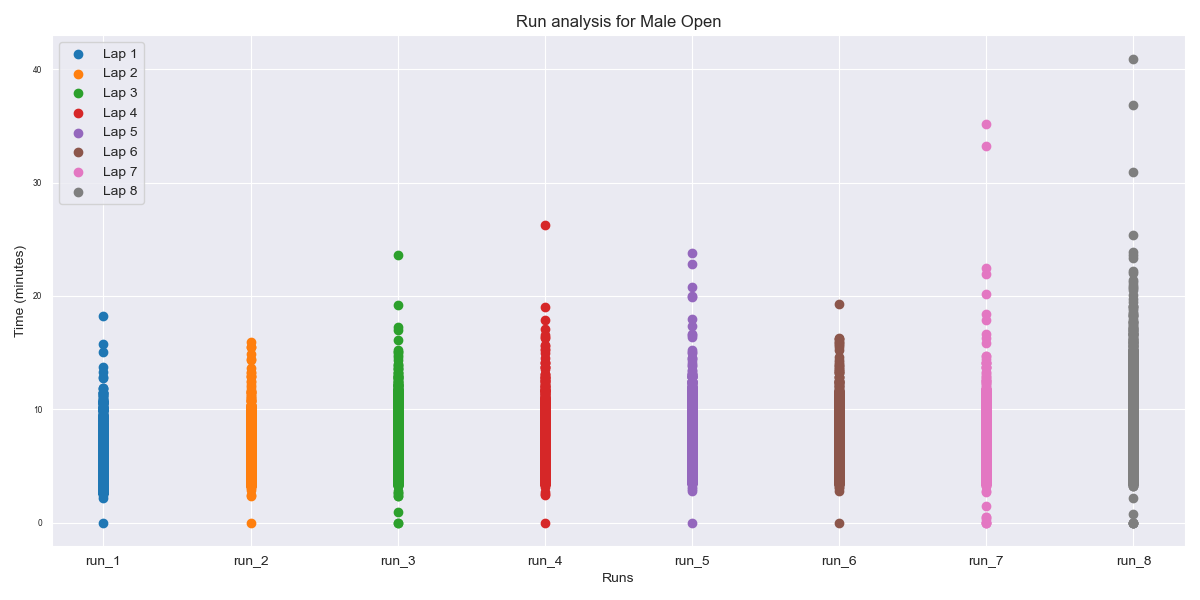
The run times distribution offers less to analyse, with average times slightly increasing as the race goes on, and variability increasing as well, however, staying fairly consistent with no big jumps. Some of the outliers on runs 2 and 3 can be explained by athletes running an extra lap, which is a common mistake amongst competitors. One interesting point is how the average time slightly decreases on run 6, compared to the previous one. Station 5 is the Row-Erg, which is considered as the mid-way point of the race, and a station that athletes use to recover, rather than push.
How do the top athletes attack a race and how does their approach differ from the rest of the field?
Another interesting question that came to mind was how would those athletes with the best finish times compare to the average HYROX competitor, or even to the athletes who struggle the most during the race. It’s tempting to attribute better times solely to being ‘fitter,’ but this explanation, while partially true, doesn’t tell the whole story. Given the complexity of the event, there must be more to it than simply training harder.
To explore this, I analysed data from a specific race (London 2023, chosen arbitrarily). I examined the average times of the top 20 athletes, the average values across all competitors, and the average times of the bottom 20 athletes for both runs and stations. The findings from this analysis:
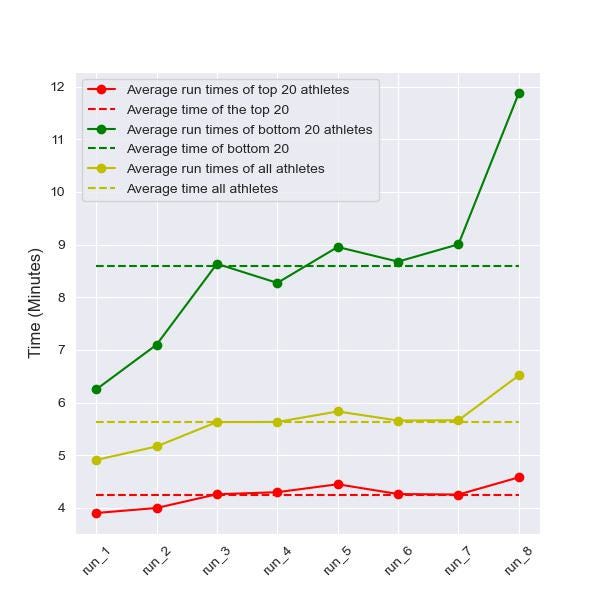

- Consistent pacing: Top performers demonstrate remarkable consistency in their run times, maintaining a steady pace from the first to the last run. This contrasts with the bottom 20 performers, whose run times significantly increase as the race progresses. Notably, if these lower-ranked athletes started their first run at around 8 minutes (a pace 2 minutes slower than their initial pace) and maintained this consistency throughout the race, they would achieve a lower average run time, as shown in the left-hand side graph.
- Sled Pull to Burpee Ratio: The station graph (right) reveals that elite athletes manage to keep their burpee broad jump times in line with their sled pull times. In contrast, the bottom performers struggle to maintain this ratio. This disparity suggests that these athletes might be exerting too much effort too early, which ultimately negatively impacts their overall race performance.
- Similar ERGs ratios: Interestingly, all competitors handle the ERGs relatively well. There is a slight increase in times from the Ski-Erg to the Row-Erg among the bottom half of athletes, but this difference is minimal and likely due to accumulated fatigue.
- Mental Fatigue? A significant increase in times for lunges and wall balls is observed among the bottom 20 competitors, compared to both the average across all competitors and the top performers. These exercises are challenging, and the accumulated fatigue throughout the race is expected to slow athletes down. However, the substantial jump in times raises the question of mental fatigue. It appears that these athletes may have exhausted their physical and mental reserves, leading to longer breaks and slower restarts during these final exercises. This suggests that mental endurance training could be as crucial as physical training for improving performance in these stations.
Can Machine Learning techniques further explain what the main factors contributing to one’s race are?
Next, I wanted to see if we could train a model that, given an athlete’s station and run times, could accurately predict the percentile within which the athlete will finish. Percentiles were split each 20% — so the model had 5 possible classifications for an athlete’s finishing position.
A HYROX race presents non-linear characteristics, due to several aspects.
- Pacing Strategies and Individual Strengths: Athletes employ different pacing strategies, and the way they approach the runs varies based on their individual strengths. For example, a strong runner may aim to maximize their speed during the running segments, while another athlete with a similar finish time may focus on recovery during the runs and push the stations harder. This variation in strategies introduces non-linearity in performance data.
- Athlete Recovery: Athletes differ in their ability to recover during the ‘easier’ stations. Some may excel in maintaining their performance across different segments, while others might use certain stations to recover, which leads to non-linear patterns in overall performance.
- Course Setup: HYROX events are held in various venues, some of which can be outdoors. The course layouts are always different, affecting athletes’ performances in non-linear ways. Factors such as temperature, humidity, and course design can influence how athletes perform in each section of the race.
- Psychological Factors: Psychological conditions also play a crucial role. Athletes react differently to the pressures of competition and other factors that can arise during the race. These psychological responses can lead to non-linear variations in performance.
Considering all of the above, I decided that a Random Forest can handle well this type of problem, providing a fast solution (compared to models such as neural networks) that can adapt to the complex nature of the relationship between events in such a race.
In terms of the setup, a gird-search trialling different depths, min-samples leafs and total estimators in the forest was used, along with 3-fold cross-validation.
    X = df[RUN_LABELS + WORK_LABELS]
    y = df['Top Percentage']
    random_state = 42
    X_train, X_test, y_train, y_test = train_test_split(X, y, test_size=0.2, random_state=random_state)
    rf = RandomForestClassifier(random_state=random_state)
    params = {
        'max_depth': [2, 5,12],
        'min_samples_leaf': [5, 20, 100],
        'n_estimators': [10,25,50]
    }
    grid_search = GridSearchCV(estimator=rf, param_grid=params, cv=3, verbose=1, scoring="accuracy")
    grid_search.fit(X_train, y_train)
Results
Having trained the model, results showed 74.11% accuracy in predicting one of the percentile groups. Whenever the right group wasn’t predicted, it was either one group below or above being predicted. This makes sense, given the points we’ve raised earlier regarding differences between races across different locations. A time good enough for a top finish on one course might only be mid-ranked on a faster course. Furthermore, although the dataset is balanced in terms of observations in each group, it is worth noting that the variability within the percentile group can also negatively impact the model’s performance. The split across only 5 percentile groups does a good initial job of accounting for some of the variance across locations. However, athletes within the mid-range groups have a lot of overlap in their run times and, combining this with the discrepancies in average finish times across different locations can lead to erroneous predictions.
Accuracy was chosen as an evaluation metric due to the balanced nature of the dataset and its applicability. Furthermore, the model’s overall performance was of interest, rather than its ability to predict a certain class.
Once the model was trained, the next question to be answered was what are the main attributes the model looks at for predicting one’s percentile finish.
Using SciKit’s default feature_importances_ attribute, which calculates the importance of each attribute in the model based on its Gini impurity, we could further analyse the results of our model.

    feature_names = RUN_LABELS + STATIONS
    importances = pd.Series(rf_classifier.feature_importances_, index=feature_names)
    importances_sorted = importances.sort_values(ascending=False)
    plt.figure(figsize=(6, 6))
    sns.barplot(x=importances_sorted.values, y=importances_sorted.index, palette='viridis')
    plt.xlabel("Importance")
    plt.ylabel("Feature")
    plt.title("Feature Importance")
    plt.show()
Results show that burpees, lunges and wall balls are the most important functional stations in a HYROX race. Again, this confirms our initial analysis, as these are the exercises with the largest variation, even between the competitive athletes, hence showing that these would be the stations that could truly make the difference in a HYROX race.
Moreover, seeing the final run as the most important of the runs also makes sense. Many athletes can start off really fast, however difference is in the way they can sustain the initial pace, and finishing on a fast run clearly signals a fit athlete with a good finish.
Finally, Run 5 being the second most important run can be attributed to all the stations prior. It is a mix of sled push, pull and burpees, some of the most taxing workouts on the legs, hence an athlete’s ability to recover and maintain a fast pace after these stations is a clear indicator of high fitness levels and a potential top percentile finish.
Future Steps
The amount of data available to be scraped is exciting and leaves room for further development. It would be interesting to assess whether a model with less features can perform better? Are some of the runs actually acting as noise. For example, only runs 1, 5 and 8 could give a general idea of how an athlete performs in the running part of the race. Similarly, would leaving out the SkiErg improve model performance? Would maybe creating a combined sled push and pull variable improve prediction accuracy? Rather than a combined variable, should we look at an athlete’s sled push-pull ratio? Or the ratio between first and last run? Should we choose one reference race, and scale all other times according to this one race to remove confusion from the model? All exciting questions to be explored.
From a software engineering point of view, the data could be stored in a database, and easily retrieved for plotting and analysis purposes. Via a Web-UI, users could search up their names, and quickly see where they rank — and compare themselves against average times, either for the specific Hyrox season, for Hyrox overall, or in the specific race they competed in.
I aim to explore these areas in a future post!
Conclusion
As HYROX continues to grow, I expect more data science tools and projects to leverage the large amount of data available. In the chase for faster and faster times, athletes can truly benefit from a data-driven understanding of where their times are situated within the larger picture of all racing athletes.
The analysis highlighted that burpees, lunges and wall balls are crucial stations in a race, with performance on the second half of the runs being more important in predicting a top finish.
Whether an elite athlete or someone competing for a personal challenge, a great deal can be gained from applying a data-driven approach to training and identifying key areas to improve and specify your training.